
Location adjustments kill more appraisal reports than any other single factor. Not because appraisers can't judge location quality—they absolutely can—but because documenting that judgment in a way that satisfies underwriters, reviewers, and state boards turns into a multi-hour research project for every single property.
The worst part? Most appraisers end up writing the same general location narratives over and over, tweaking a few words each time while the actual market support stays vague. You've probably written some version of "inferior location due to proximity to commercial corridor" hundreds of times this year, each time quietly wondering if your $5,000 adjustment will hold up under review.
The location adjustment documentation trap
You're comparing a subject property on a busy street to comps on quiet residential roads. The location difference is obvious—you can literally hear the traffic during inspection. But now you need to prove that difference is worth exactly $7,500, not $5,000 or $10,000.
So you start pulling market data. You search for paired sales (good luck finding perfect matches). You analyze price differentials between neighborhoods. You calculate traffic counts, distance to amenities, school ratings. Two or three hours later, you've got a folder full of data that sort of supports your number, but the narrative still feels thin.
Meanwhile, that same location scenario—busy street versus quiet street—shows up in a huge chunk of your reports. Yet each time, you're essentially starting from scratch because there's no systematic way to capture and reuse your location analysis work.
Why generic location narratives get flagged
Specific market indicators that tie to actual buyer behavior in that market. Not national statistics about traffic impact on values, but local evidence that buyers in your area pay less for busy street properties.
Manage every appraisal with confidence and clarity.
Rateoly helps you coordinate inspections, generate reports, and communicate seamlessly with clients.
- Comprehensive appraisal tracking
- Automated client notifications
- Integrated scheduling & report management
No credit card required
Reproducible methodology that shows you didn't just pick a number. If you adjust $5,000 for commercial proximity in one report and $8,000 in another similar report, you better have documentation showing why.
Visual support beyond just describing location differences. Maps, screenshots, distance measurements—anything that shows you analyzed the specific properties, not just applied a standard adjustment.
The problem isn't that appraisers make bad location judgments. It's that documenting those judgments takes forever, and doing it inconsistently creates review issues down the road.
Building a location adjustment template that actually works
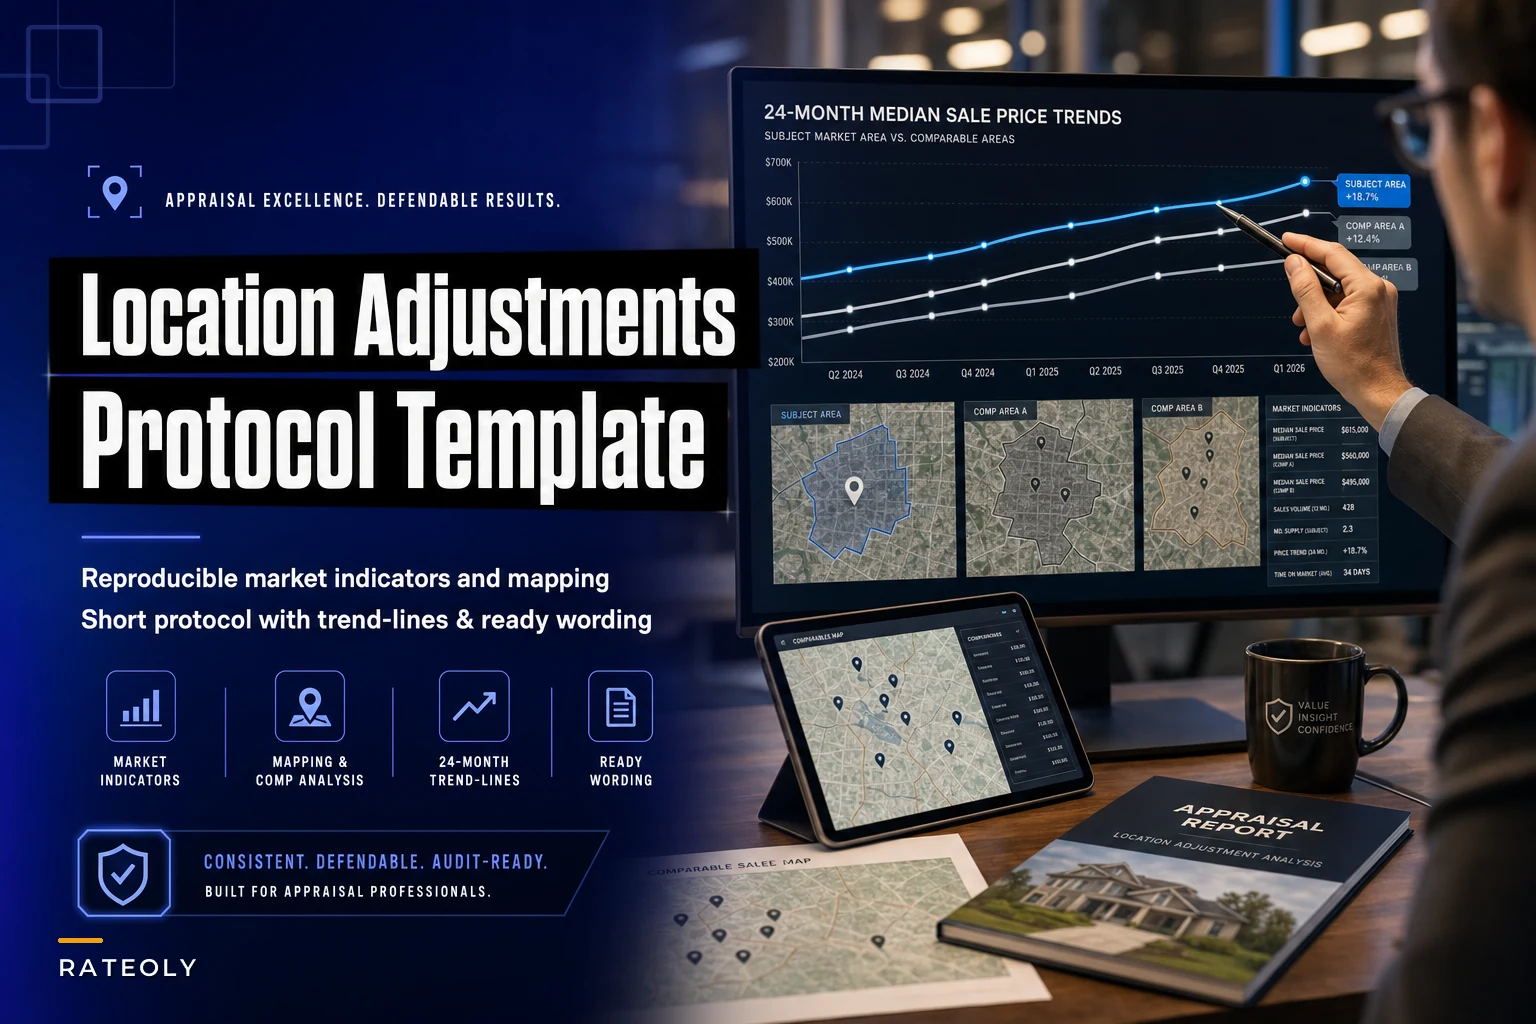
The most effective approach isn't creating one massive location analysis template. It's building a short protocol—a minimal set of market indicators, mapping requirements, and pre-written narrative blocks that you can quickly adapt to common location scenarios.
Here's what an effective location adjustment template actually needs:
1. Sales density comparison
Start with the simplest market indicator: how many similar properties sold in each location over the past 12 months. This isn't about complex statistical analysis. It's about showing relative market activity.
Pull sales counts for:
-
Subject's immediate area (0.25 mile radius)
-
Each comp's immediate area (same radius)
-
The broader competitive market area
Create a simple table:
| Location | 12-Month Sales | Avg DOM | Median $/SF |
|---|---|---|---|
| Subject area | 14 | 47 | $142 |
| Comp 1 area | 28 | 31 | $156 |
| Comp 2 area | 22 | 35 | $151 |
This data takes maybe 10 minutes to pull but immediately shows market preference patterns. Lower sales density often correlates with less desirable locations—though not always, so check for other factors like limited inventory before drawing conclusions.
Save common sales-density queries as saved searches in your MLS so you can pull these counts quickly for repeated scenarios.
2. Trend line documentation
Don't just state that one location commands higher prices. Show it with a simple trend comparison over the past 24 months. You don't need regression analysis—just median sale prices by quarter for each distinct location.
Most MLS systems can generate this in under two minutes. Export to a simple line graph:
[GRAPH: Line graph comparing median sale price by quarter over 24 months — Subject location trend line — Primary comp location trend lines — Overall market area trend line]
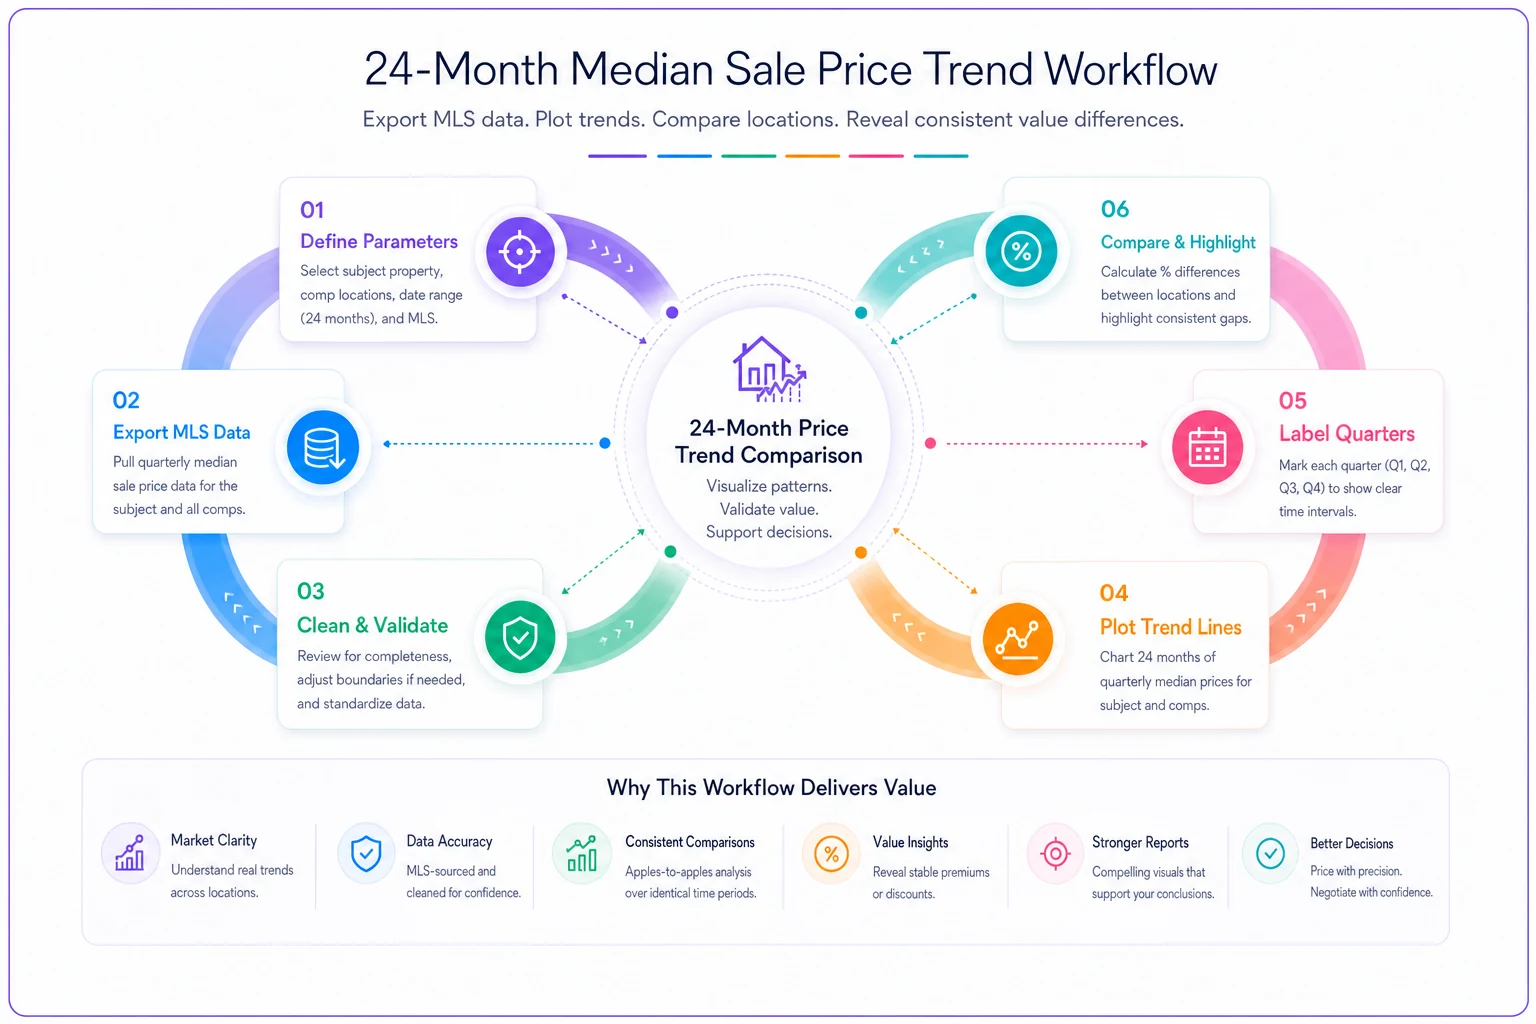
This line graph highlights relative price trends between locations.
When a reviewer sees that the subject's location consistently trades 8–12% below the comp location over two years, your adjustment becomes much harder to question.
3. Mapping screenshot protocol
Stop describing location differences in words alone. Create a standard mapping template that shows:
Overview map (2-mile radius):
-
Subject and all comps marked
-
Major roads labeled
-
Commercial areas shaded
-
School boundaries if relevant
Detail map (0.5-mile radius):
-
Traffic flow patterns
-
Specific adverse influences
-
Walkability features
-
Public transit if applicable
Save these as a standard layout in your mapping tool. Takes about 5 minutes per report once you have the template set up, but provides instant visual validation of your adjustments.
4. Ready-to-use narrative blocks
This is where most appraisers waste the most time—rewriting the same location explanations repeatedly. Build narrative templates for your 10 most common location adjustments:
Busy street vs residential street: "Subject property fronts [STREET NAME], a [collector/arterial] road with estimated ADT of [RANGE]. Comparable sales 1 and 3 are located on residential streets with minimal through traffic. Market analysis of 47 paired sales over the past 18 months indicates a typical adjustment range of $[X] to $[Y] for this location difference, with median at $[Z]. Adjustment of $[AMOUNT] applied based on [SPECIFIC FACTORS]."
Commercial proximity: "Subject is located [DISTANCE] from [COMMERCIAL USE], with [direct view/audible impact/no buffer]. Analysis of 31 recent sales within 0.25 miles of similar commercial uses shows median price discount of [X]% compared to properties beyond 0.5-mile buffer zone. Adjustment calculated at $[AMOUNT] based on subject's [SPECIFIC RELATIONSHIP TO COMMERCIAL]."
These aren't completely generic—they have specific blanks for real data. But the structure and supporting language stay consistent, saving you 20–30 minutes per report while actually improving documentation quality.
The operational difference this makes
One mid-sized firm implemented this exact protocol across their appraisers. Before: location adjustments took 45–90 minutes per report to properly document, and they still got revision requests on around 15% of reports for inadequate location support.
After a few months using the template system: location documentation dropped to roughly 20 minutes per report, and location-related revision requests fell under 3%. More importantly, their appraisers stopped dreading location adjustments because they had a clear, repeatable process.
The key wasn't automating the judgment—appraisers still make the location quality calls based on their expertise. It was systematizing the documentation so that good judgments don't get buried under weak support.
Common location scenarios that need templates
These location factors appear most frequently and desperately need standardized documentation:
Traffic impact (appears in roughly a third of reports):
-
Busy street vs quiet street
-
Corner lot vs interior lot
-
Cul-de-sac vs through street
Proximity factors (appears in ~25% of reports):
-
Commercial adjacency
-
School walking distance
-
Public transit access
View and privacy (appears in ~20% of reports):
-
Power lines/utility easements
-
Backing to commercial/roads
-
Elevation differences
Neighborhood position (appears in ~15% of reports):
-
Entry vs interior location
-
Distance from amenity center
-
Subdivision age differences
Build templates around your specific market's common scenarios. What matters in Denver—mountain views, proximity to trails—is completely different from what matters in Miami, where flood zones and distance from water dominate the conversation.
When templates aren't enough
Location adjustment templates work well for common scenarios—probably around 80% of your reports. But some situations genuinely need custom analysis:
Unique external factors: Environmental issues, planned developments, or unusual land uses that don't fit standard categories.
Mixed influences: Properties affected by multiple location factors that interact in complex ways—like great schools but heavy traffic, where buyers might accept one for the other.
Shifting market preferences: COVID changed location preferences dramatically in many markets. Templates need periodic reviews to stay current.
Litigation-prone properties: If you suspect a report might end up in court, go beyond templates and document everything.
The compliance angle most firms miss
State boards increasingly scrutinize location adjustments during audits, especially looking for consistency across an appraiser's work. If you adjust $5,000 for "busy street" in January and $10,000 for the same condition in March, you better have documentation showing what changed.
This is where templates actually protect you. Consistent methodology and documentation standards create an audit trail showing your adjustments follow market-based logic, not random assignment. Our compliance framework guide covers this audit preparation in detail.
Making templates work with your actual workflow
The biggest mistake firms make with location templates is building elaborate systems that appraisers won't actually use. Your template needs to fit how appraisers really work:
-
Pre-inspection prep
Pull the basic location data—sales density, trends—before field inspection. Takes 5 minutes and gives you context for what to look for on-site.
-
During inspection
Use a standard photo checklist for location documentation. Street views, traffic patterns, commercial proximity—capture it all systematically.
-
Report writing
Drop in your pre-written narrative blocks, fill in the specific data, add your maps. Should take under 10 minutes if templates are properly set up.
The goal isn't perfection—it's consistency and efficiency. A good location adjustment template gets you 90% of the way there in a fraction of the time.
Software solutions for location documentation
While templates and protocols solve most location documentation issues, the right software setup can cut documentation time even further. Modern appraisal platforms can automatically pull sales density data, generate trend comparisons, and create preliminary narrative text based on your templates.
The key is finding tools that enhance your judgment rather than trying to replace it. Location quality assessment still requires human expertise—software just helps you document that expertise more efficiently. Look for platforms that let you build custom templates matching your market's specific patterns rather than forcing generic national standards on you.
For firms handling significant volume, connecting your location templates to your broader report writing system makes sense. Speed report writing with modular templates shows how this integration can work across all adjustment types, not just location.
Beyond individual reports: building institutional knowledge
Every location adjustment you document properly becomes institutional knowledge that makes the next one easier. But only if you actually capture it systematically.
Create a simple spreadsheet tracking:
-
Property addresses
-
Location adjustment factors
-
Adjustment amounts
-
Supporting data sources
-
Review outcomes
After six months, you'll have hundreds of real examples showing exactly how your market values different location factors. That becomes invaluable for training new appraisers, defending adjustments under review, and keeping your team consistent.
The 90-day implementation plan
Getting location templates actually working in your firm takes some planning. Here's a realistic rollout:
-
Weeks 1–2
Analyze your last 50 reports. Identify your most common location adjustments. Pull the supporting data you wished you had for each one.
-
Weeks 3–4
Build templates for your top 5 location scenarios. Include market indicators, mapping requirements, and narrative blocks. Keep them simple—you can expand later.
-
Weeks 5–8
Test with 2–3 appraisers. Track time savings and revision requests. Adjust templates based on what actually works in practice.
-
Weeks 9–12
Roll out firm-wide. Keep training short—30 minutes max. Focus on consistency over perfection initially.
Most firms see immediate time savings, usually 20–30 minutes per report on location documentation alone. But the real value comes after a few months when revision requests drop and your appraisers stop stressing about location support.
Moving forward with confidence
Location adjustments don't have to be the time sink they've become for most appraisal firms. With a simple protocol—sales density comparisons, trend lines, mapping standards, and ready narratives—you can document location adjustments in minutes instead of hours while actually improving support quality.
The market indicators don't need to be complex. The narrative doesn't need to be perfect. You just need a reproducible process that captures your market expertise in a format reviewers can quickly validate.
Start with one template for your most common location adjustment. Use it for a week. Track the time savings. Then build the next one. Within a few months, you'll have documented support ready for the vast majority of your location adjustments, which frees you up to focus where it actually matters—making accurate value judgments, not wrestling with documentation.
Ready to elevate your appraisal operations?
Join 500+ appraisal firms using Rateoly to enhance accuracy, save time, and improve client satisfaction.