
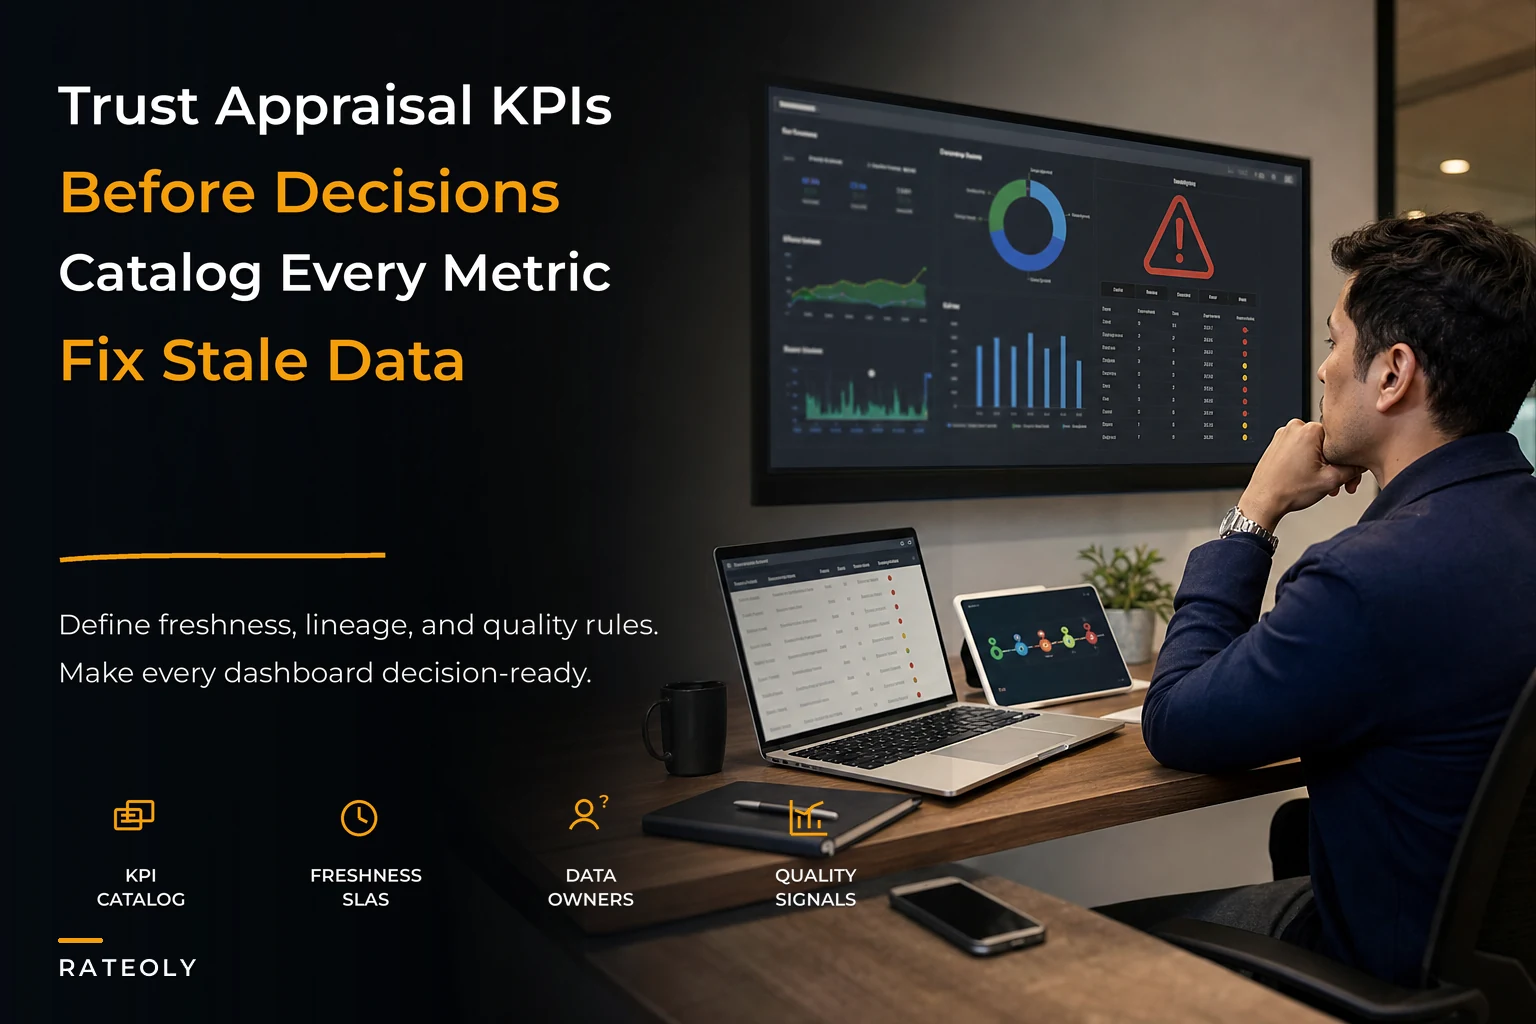

There's a particular moment that happens in a lot of appraisal firms once they get past three or four appraisers. Someone in a Monday meeting pulls up a dashboard, points at a number, and an appraiser in the room says, "That's not right — I closed that file two days ago." And then the whole conversation stops being about the business and becomes about whether the number is real.
That's when trust dies. Once one KPI gets publicly debunked in a meeting, every other number on the screen inherits the suspicion. People start keeping their own spreadsheets again. The dashboard becomes decoration. And the money you spent building reporting becomes a sunk cost nobody mentions. Appraisal metrics governance is the discipline that prevents that — not by making prettier dashboards, but by making numbers you can actually defend when someone challenges them. The real work isn't visualization. It's knowing where each number came from, how fresh it is, how it was measured, and what to do when it drifts. That's the part most firms skip, and it's also the part that decides whether anyone trusts the screen.
Why dashboards lose trust in the first place
Dashboards rarely fail because the chart is wrong. They fail because the definitions underneath are fuzzy, and nobody agreed on them before the chart got built.
Take "turn time." Sounds simple. But in one firm it means order received to report delivered. In another it means inspection complete to delivery. One counts calendar days, another counts business days. One stops the clock when the file goes to the client; another stops it when the client stops kicking it back. Put four appraisers in a room and you'll get four different stopwatches. So when the dashboard shows an average of 6.2 days and an appraiser knows their last ten files cleared in under four, they're both right — they're just measuring different things.
What tends to happen in a lot of small shops is that KPI definitions live in someone's head — usually the owner's or the ops lead's. The dashboard gets built off whatever that person described verbally to a contractor, or configured themselves at 11pm. Nobody wrote the definition down. Six months later the ops lead leaves, a new person inherits the dashboard, and the numbers slowly stop matching reality because the logic was never documented.
The second failure is staleness. A number can be perfectly correct and still be useless if it's three syncs behind. If your MLS pull runs nightly but your dashboard caches comp counts weekly, you'll be looking at Tuesday's world on Friday and making staffing calls off it. Nobody told the viewer the data was five days old, so they treated it as live.
The third is silent breakage. An integration changes a field name, a feed drops for a day, an appraiser's status update doesn't fire — and the chart keeps rendering. It doesn't show an error. It shows a confidently wrong number. That's actually worse than a blank screen, because a blank screen makes people ask questions and a wrong number makes people act.
The four things a trusted KPI actually needs
A KPI you can stand behind in a tense meeting has four layers underneath it. Most firms build the top layer (the chart) and none of the bottom three.
Manage every appraisal with confidence and clarity.
Rateoly helps you coordinate inspections, generate reports, and communicate seamlessly with clients.
- Comprehensive appraisal tracking
- Automated client notifications
- Integrated scheduling & report management
No credit card required
| Layer | What it answers | What happens when it's missing |
|---|---|---|
| Definition | What exactly is this measuring, and where does the clock start/stop? | Arguments in meetings; two people "both right" |
| Lineage | Where did this number come from and how was it calculated? | Nobody can trace or fix a wrong number |
| Freshness SLA | How current is this, and when does it refresh? | Stale data treated as live; bad decisions |
| Remediation path | What do we do when it drifts or breaks? | Problems fester; trust erodes quietly |
Each missing layer creates a specific kind of mistrust. Missing definitions create arguments. Missing lineage creates helplessness. Missing freshness creates bad timing. Missing remediation creates resentment. Fix the layers and the mistrust tends to go away on its own.
Sampling: you can't verify everything, so verify the right slice
There's a tension here that doesn't get talked about enough. If your defect-rate KPI is computed from 100% of files automatically, you're trusting the automated tagging — which is often the thing that's broken. If it's computed from manual QC reviews, you're only reviewing a fraction of files, so the number is a sample whether you admit it or not.
So be honest about it and design the sample on purpose instead of letting it happen by accident.
-
Stratify by risk, not randomly. Pull a higher sample rate from complex assignments, new appraisers, and any product type that generated exceptions last quarter. A flat 10% random sample wastes review hours on easy conforming files and under-checks the ones that actually bite you.
-
Fix the sample size per stratum so the rate stays stable. "We review every complex file and 1 in 8 standard files" is easier to trust than "we review whatever we get to."
-
Lock the review window. If you sample a file a month after delivery, the client already saw the error. Sample within the turn cycle so remediation still matters.
-
Write down the sampling rate next to the KPI. A defect rate of 3% from a 100% sample and a defect rate of 3% from a 12% sample are different claims. The viewer deserves to know which one they're looking at.
Make the sampling strata and rates visible alongside the KPI so viewers understand the claim.
The mistake that comes up constantly: a firm reports "defect rate dropped from 5% to 2%" and celebrates, when what actually dropped was the review rate. Fewer files reviewed, fewer defects found, number looks better, nothing improved. If you don't govern the sample, the KPI will quietly lie in whatever direction reduces work.
If you want a deeper look at which metrics are even worth tracking and sampling in the first place, the breakdown in which KPIs actually move the needle for appraisal teams pairs well with this — pick the metrics first, then govern them.
Data-quality SLAs: freshness is a promise, not a hope
Every number on a dashboard is making an implicit promise about how current it is. The problem is the promise is unspoken, so every viewer assumes a different one. Make it explicit.
A data-quality SLA for a KPI is just a short, written commitment covering three things: how fresh, how complete, and how accurate the data behind it should be — plus what counts as a breach.
-
Order pipeline KPIs refresh within 15 minutes of a status change. Breach = any status older than 30 minutes without updating.
-
MLS/comp availability counts refresh nightly. Breach = feed missed for more than one cycle, or record count drops more than roughly 40% day over day (usually a broken feed, not a quiet market).
-
Turn-time and SLA-compliance metrics finalize at file delivery and don't change retroactively. Breach = a delivered file's timestamps shift after the fact.
-
Financial/AR KPIs reconcile weekly against the accounting system. Breach = variance beyond a small tolerance between dashboard and books.
The useful part isn't the schedule. It's the breach definition. Once "breach" is defined, the dashboard can flag its own freshness instead of silently showing stale numbers. A simple "last updated 3 hours ago — expected within 15 min" banner does more for trust than any chart. People stop assuming and start reading the age of the data.
This is where lightweight tooling earns its keep. Operational platforms with built-in data-quality checks can watch feed timestamps and record counts automatically, raising a flag when a freshness SLA is breached — so a dropped MLS sync shows up as a banner Monday morning instead of as a bad staffing decision Monday afternoon. The value isn't automation for its own sake; it's that the people reading the dashboard find out the data is stale before they act on it.
Lineage notes: the difference between fixable and hopeless
When a number looks wrong, the first question is always "where did this come from?" If nobody can answer in a few minutes, the number is effectively dead — you can't defend it and you can't fix it.
Lineage notes are the short trail behind each KPI. Not a formal data catalog that takes a quarter to build. For a small firm, a lineage note for one metric can be three or four lines:
-
Source which system, feed, or field the raw data comes from
-
Transformation what filtering or math is applied (e.g., "business days only, excludes files in client-hold status")
-
Owner who maintains this definition and approves changes
-
Last changed when the logic was last touched, and by whom
That last line matters more than it looks. A large share of "the dashboard is wrong" incidents trace back to someone quietly changing a definition — adding a filter, excluding a product type — without telling anyone. The number genuinely changed; nobody knew why; trust took the hit. A dated change log on the definition itself ends that whole category of confusion.
This connects directly to how you handle your underlying comp and file data. Governing the metric is pointless if the data feeding it is a mess, which is the whole argument in why lightweight data governance beats one-off fixes. Clean inputs, documented lineage, trusted output — in that order.
Remediation playbooks: decide the response before the breach
The reason most firms don't recover trust after a bad-number incident is that the response is improvised every time. Something breaks, someone notices days later, there's a scramble, a vague "we'll look into it," and then it happens again next month. The drift keeps recurring because there's no standing plan for it.
A remediation playbook is just the pre-agreed response to a specific type of breach. One per common failure mode. Keep it short.
-
Dashboard auto-flags the comp KPI as stale (freshness SLA breach).
-
Designated owner gets notified same morning, not next week.
-
Affected KPIs show a "data suspect" state instead of a confident wrong number.
-
Owner checks feed, re-runs sync, confirms record counts back in normal range.
-
Short note logged
what broke, when, what was affected, when it was resolved.
Example — turn-time definition dispute surfaces in a meeting:
-
Pull the lineage note for turn time on the spot.
-
If the definition is correct and the data's fresh, the number stands — and the appraiser's local view is the one that's off.
-
If the definition is genuinely wrong or ambiguous, log it, fix the definition once, and re-run historicals so old reports match.
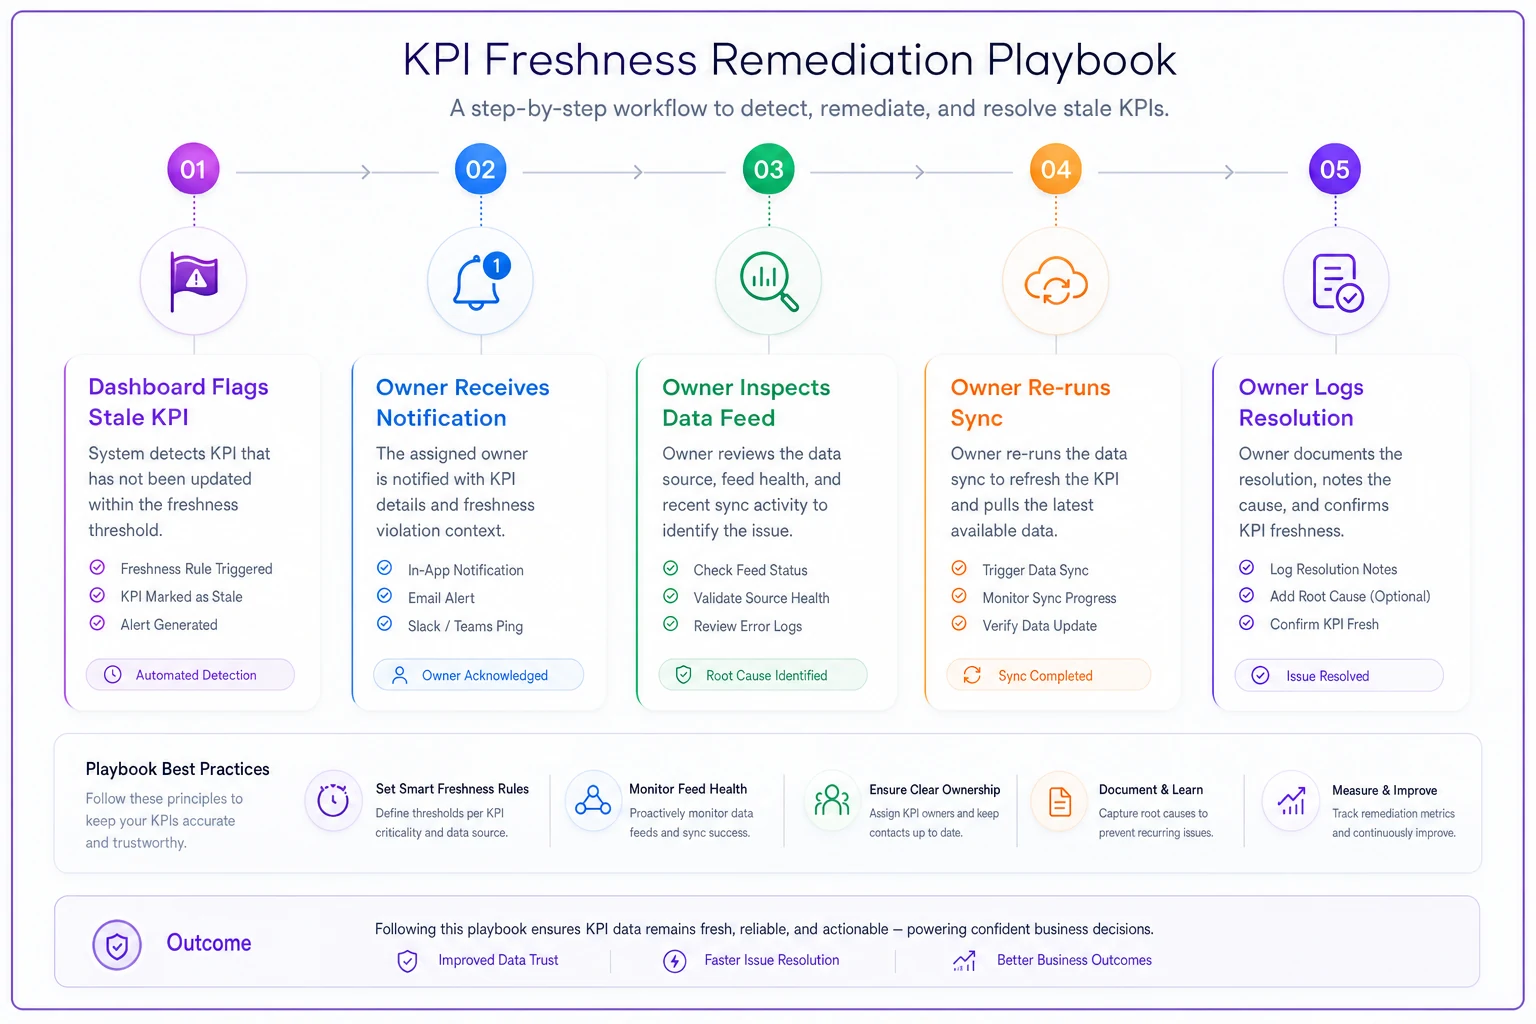
A quick visual of the remediation workflow helps teams see responsibilities and sequence at a glance.
The quiet benefit here is cultural. When people see that a flagged number gets a named owner and a logged resolution — instead of a shrug — they start trusting the system, not just individual numbers. Trust comes from watching problems get handled predictably, not from numbers never being wrong.
A real scenario
A four-appraiser firm had a reporting setup that technically worked. The owner reviewed dashboards every Monday to plan the week. The problem was turn time kept reading high — around 7 days — while the owner's gut said files were moving faster. After two months of this, nobody on the team believed the number, and the owner had quietly gone back to counting open files by hand.
The root cause was boring, which they usually are. The "delivered" status wasn't being set consistently — two appraisers marked files delivered, two didn't, relying on the upload to the AMC portal to count as done. So the clock never stopped on half the files, dragging the average up. No chart could have told them that; lineage was the missing piece.
They did three things. Wrote a one-line definition of "delivered" that everyone agreed to. Added a freshness flag so stale statuses showed as suspect instead of blending into the average. And set a dead-simple remediation step: any file still "open" past its SLA with no activity gets checked, not averaged in blindly.
Turn time settled somewhere in the low-5-day range — not because work got faster, but because the number finally reflected reality. More importantly, the owner started using the dashboard again instead of the manual count. The hour or so a week spent recounting by hand went away. That's the real return on governance: not a better chart, but a number people stop double-checking.
When this is worth it — and when it's overkill
Worth doing when:
-
You have more than a couple appraisers and people are keeping private spreadsheets alongside the "official" dashboard
-
Numbers get challenged in meetings and the challenge usually wins
-
You're using dashboards to make staffing, pricing, or capacity calls — decisions with real money attached
-
Definitions live in one person's head and that person is a single point of failure
Probably overkill when:
-
You're a solo appraiser who knows your own pipeline cold without a dashboard at all
-
Your reporting is one simple open-order count that nobody disputes
-
You'd spend more time governing metrics than the decisions those metrics drive are worth
One thing worth flagging: firms that haven't even decided which KPIs matter yet shouldn't go all-in on this. Governing the wrong metrics perfectly is wasted effort. Pick the handful of numbers that actually drive decisions first, then govern those. Don't build lineage notes and SLAs for a dashboard full of vanity metrics nobody acts on.
Pulling it together
Trusted appraisal metrics governance isn't a reporting feature you buy. It's four habits layered under every number that matters: an agreed definition, a traceable lineage, an explicit freshness promise, and a standing plan for when things drift. Skip those and your dashboard is just confident-looking decoration that people slowly stop believing.
The firms that get the most out of their reporting aren't the ones with the slickest charts. They're the ones where someone can challenge a number, the owner can trace it in two minutes, and the answer is either "the number's right, here's why" or "good catch, here's the fix and it's logged." That predictability is what turns a dashboard from wallpaper into something people actually plan the week around. Get the governance right and the trust follows — and once people trust the screen, you stop paying the hidden tax of everyone quietly recounting everything by hand.
Trusted appraisal metrics governance isn't a reporting feature you buy. It's four habits layered under every number that matters: an agreed definition, a traceable lineage, an explicit freshness promise, and a standing plan for when things drift. Skip those and your dashboard is just confident-looking decoration that people slowly stop believing.
The firms that get the most out of their reporting aren't the ones with the slickest charts. They're the ones where someone can challenge a number, the owner can trace it in two minutes, and the answer is either "the number's right, here's why" or "good catch, here's the fix and it's logged." That predictability is what turns a dashboard from wallpaper into something people actually plan the week around. Get the governance right and the trust follows — and once people trust the screen, you stop paying the hidden tax of everyone quietly recounting everything by hand.
Ready to elevate your appraisal operations?
Join 500+ appraisal firms using Rateoly to enhance accuracy, save time, and improve client satisfaction.