



Most appraisal firms track the wrong things. Report count, gross revenue, average fee — these numbers look fine on paper but completely miss the operational reality. Meanwhile, the metrics that actually predict whether you'll lose a client next quarter are buried in spreadsheets nobody opens.
Having built operational platforms for dozens of appraisal shops — everything from solo operators to 50+ appraiser teams — the pattern gets obvious fast. Firms that grow sustainably track completely different KPIs than the ones drowning in constant fires. Not because they're more sophisticated. They just figured out which numbers actually correlate with client retention and profitability.
You see it immediately in how they run monthly reviews. While most firms pull random reports and discuss whatever looks alarming that week, the better shops run structured reviews against specific thresholds. They know which metrics trigger corrective actions. They sample data systematically instead of trusting whatever their management software spits out. And they catch problems two or three weeks before clients notice anything.
The fatal flaw in standard appraisal metrics
Traditional appraisal metrics focus on production volume and revenue. Makes sense on the surface — more reports, more money. Except this completely misses how appraisal businesses actually fail.
Take a typical 8-appraiser residential firm. They track completed reports, average fees around $475, maybe turn times. Everything looks healthy. Revenue hits projections. Then they suddenly lose their second-largest lender — 35% of volume — because revision rates crept from 8% to 19% over six months. Nobody caught it because nobody was watching the right upstream indicator.
The problem runs deeper than just picking better metrics, though. Most firms pull numbers from their appraisal management software and assume the data is clean. But when you actually audit these systems, you find inspection dates missing on maybe 15% of orders, revision flags coded incorrectly, and turn time calculations that handle weekends inconsistently. The metrics might show a 4.2-day average turn time when the real number, properly calculated, is closer to 6.8 days.
Then there's the review cadence problem. Firms either review nothing systematically — just reacting to complaints — or they hold weekly marathon meetings that produce no real outcomes. Neither works. Structured monthly reviews focused on specific KPIs with clear escalation triggers are the only thing that actually moves the needle.
Core KPIs that predict operational health
Across dozens of implementations, five metric categories consistently separate firms that thrive from those that struggle.
Manage every appraisal with confidence and clarity.
Rateoly helps you coordinate inspections, generate reports, and communicate seamlessly with clients.
- Comprehensive appraisal tracking
- Automated client notifications
- Integrated scheduling & report management
No credit card required
Quality indicators catch problems before clients complain. Revision rate by appraiser, revision rate by client, and time-to-revision completion form the foundation. The real insight comes from tracking revision reasons, though. When "comparable selection" revisions jump from 2 to 5 in a month, you've got a training issue or a market shift that needs immediate attention.
Velocity metrics reveal the bottlenecks killing profitability. Average turn time matters less than turn time distribution. If 80% of reports complete in 3–4 days but 20% take 8+ days, those outliers are damaging your reputation regardless of the average. Track inspection-to-draft, draft-to-review, and review-to-delivery separately. The bottleneck almost always hides in one specific handoff.
Capacity utilization shows whether you're leaving money on the table or burning people out. Reports per appraiser seems simple until you factor in complexity. A lakefront property takes roughly three times longer than a tract home. Weight your capacity metrics by complexity scoring — a 5-point scale based on property type, value range, and unique features works well. Suddenly that "underperforming" appraiser handling all your difficult assignments looks very different.
Client concentration risk gets ignored until it's too late. Track revenue concentration by client, but also watch the early warning signals: declining order volume trends, increasing revision requests, longer payment cycles. When your biggest client drops from 45% to 38% of volume over two months, something's wrong even if total revenue stays flat.
Financial efficiency goes beyond gross revenue. Track effective hourly rate by property type, drive time as a percentage of total time, and rework hours as a percentage of productive hours. One firm discovered their rural assignments generated around $47/hour while suburban residential averaged $78/hour — which completely reshaped how they evaluated new work coming in.
Dashboard template that actually gets used
Dashboards fail when they try to show everything. The ones that drive real behavior change follow strict constraints. Here's a template that works in practice:
Weekly Snapshot Dashboard
| Metric | Current Week | 4-Week Avg | Target | Status |
|---|---|---|---|---|
| Reports Completed | 47 | 52 | 50 | ⚠️ |
| Avg Turn Time (days) | 4.8 | 4.3 | 4.0 | 🔴 |
| Revision Rate | 11% | 9% | <10% | ⚠️ |
| On-Time Delivery | 87% | 91% | 95% | 🔴 |
| Capacity Utilization | 78% | 82% | 85% | ⚠️ |
Keep the weekly snapshot to five metrics max so it actually gets reviewed every Monday morning.
Monthly Deep-Dive Dashboard
| Appraiser | Reports | Avg Turn Time | Revision Rate | Complex Properties | Effective $/Hour |
|---|---|---|---|---|---|
| Johnson | 31 | 3.8 days | 6% | 3 | $72 |
| Smith | 27 | 4.2 days | 8% | 7 | $68 |
| Williams | 24 | 5.1 days | 15% | 2 | $54 |
| Davis | 29 | 3.9 days | 4% | 1 | $81 |
| Martinez | 33 | 4.4 days | 12% | 4 | $63 |
Client Health Dashboard
| Client | Order Volume Trend | Revision Rate | Avg Turn Time | Payment Days | Risk Score |
|---|---|---|---|---|---|
| First National | ↓ -12% | 14% | 4.9 days | 38 | High |
| Regional Bank | ↑ +8% | 7% | 3.8 days | 22 | Low |
| Metro Credit | → 0% | 9% | 4.2 days | 31 | Medium |
| State Mortgage | ↓ -5% | 18% | 5.3 days | 45 | High |
Each dashboard serves a different review cadence. Weekly snapshots get a 5-minute check-in Monday mornings. Monthly deep-dives drive 30-minute operational reviews. Client health gets a quarterly strategic review unless a risk score hits "High."
Data quality rules that prevent garbage metrics
Bad data leads to bad decisions. Most firms don't have bandwidth for complex data governance, but a few lightweight sampling rules catch the majority of quality issues.
Sampling frequency: Check 10% of orders monthly, weighted toward new appraisers and problematic categories. If rural properties are showing unusual patterns, bump sampling to 25% of rural orders that month.
Revision coding audit: Every revision should have a primary reason code. Pull 20 revisions monthly and verify the coding actually matches the revision request. When "other" exceeds 20% of revision reasons, your taxonomy needs work.
Turn time validation: Pull five random completed orders weekly. Manually calculate turn time from assignment to delivery, excluding client-caused delays. Compare to system calculations. Variance over half a day indicates a calculation problem worth investigating.
Missing data flags: Run monthly reports showing the percentage of orders missing key fields — inspection date, review date, complexity score, revision flag. When any field exceeds 10% missing, you've got a process problem, not just a data problem.
Cross-system reconciliation: If you're running separate systems for scheduling and reporting, reconcile monthly. Count orders in both systems. Check that inspection dates match. Verify revision flags appear in both places. Mismatches usually point to workflow handoff problems that hurt more than just data quality.
Build these checks into a simple spreadsheet. Two hours monthly, but it prevents decisions based on numbers that don't reflect reality.
Monthly review cadence with teeth
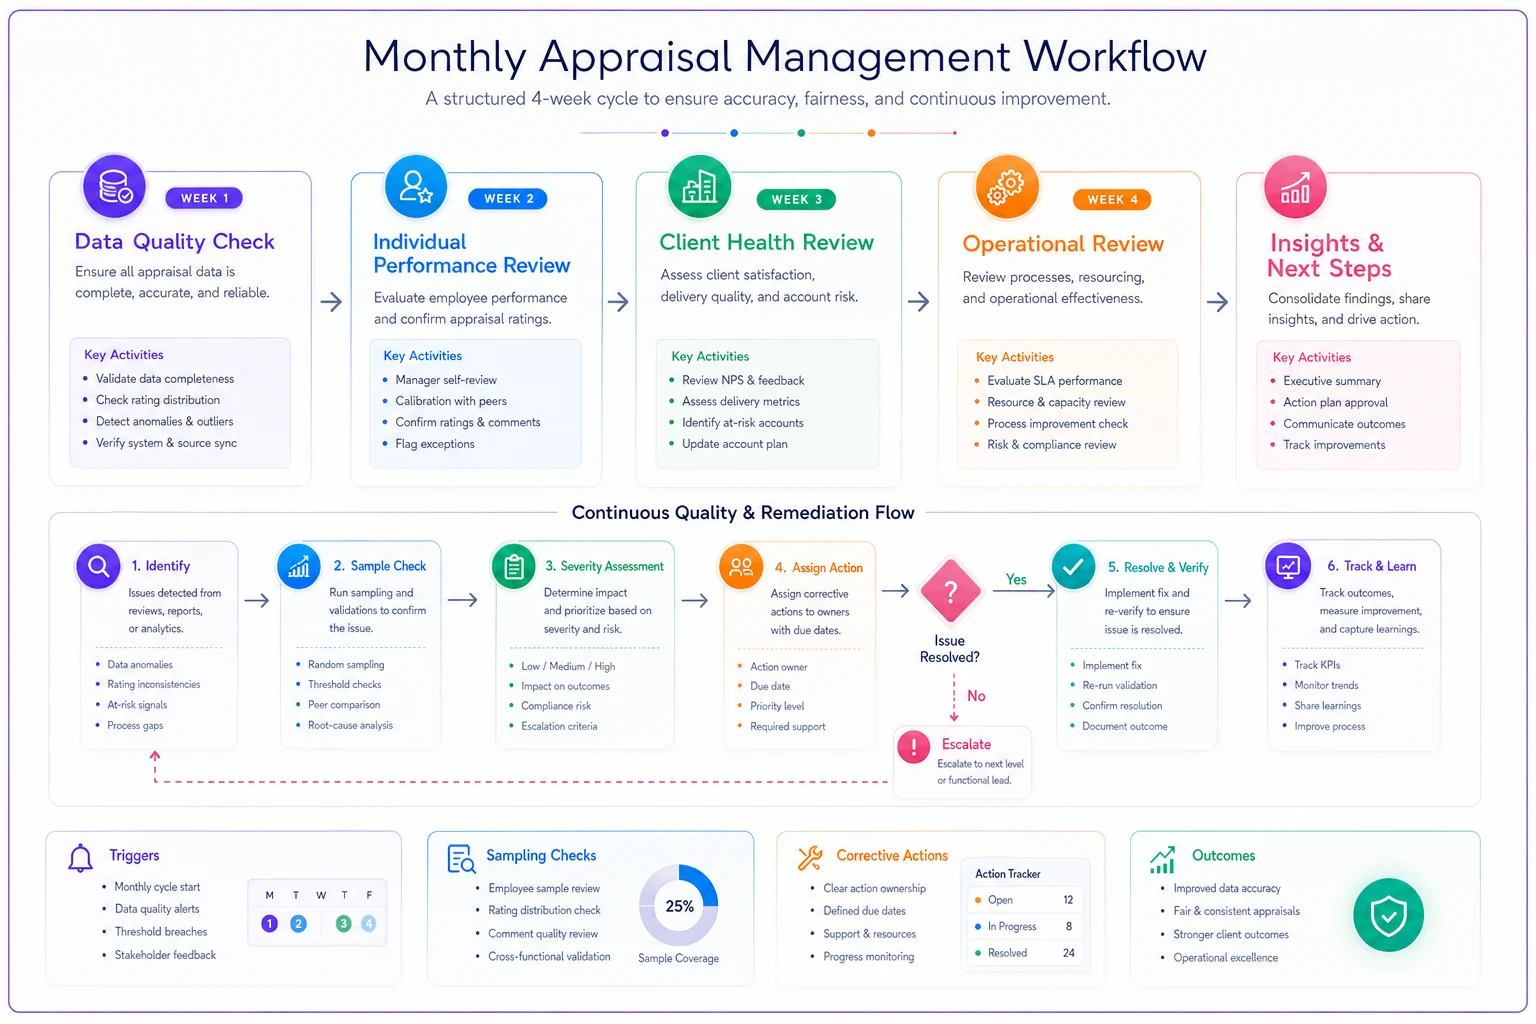
Reviews without consequences waste time. Here's a monthly review structure that actually produces outcomes:
-
Week 1
Data Quality Check (30 minutes)
- Run sampling rules - Flag questionable metrics - Note data collection gaps - Assign fixes with 2-week deadlines -
Week 2
Individual Performance Review (45 minutes)
- Review appraiser scorecards - Identify bottom quintile performers - Schedule one-on-ones for anyone below thresholds - Document specific improvement targets -
Week 3
Client Health Review (45 minutes)
- Analyze client concentration shifts - Review revision patterns by client - Check payment timing trends - Flag any client showing two or more warning signs -
Week 4
Operational Review (60 minutes)
- Review all dashboards - Distinguish systemic issues from individual problems - Approve corrective actions - Set specific targets for next month
Here's a quick visual of that monthly review workflow.
The value is in documented thresholds. Nobody debates whether 12% revisions is "too high" — if it crosses 10%, specific actions trigger automatically.
SLA triggers and corrective action mapping
SLAs without automatic triggers might as well not exist. Here's what works operationally:
Turn Time SLA Triggers
Level 1 (4.5-day average): Email notification to appraiser and reviewer. Nothing else.
Level 2 (5.0-day average): Capacity reduced 20% for two weeks. Mandatory review of next five reports before submission.
Level 3 (5.5-day average): No new complex assignments for 30 days. Daily check-in on all pending orders. Full review of inspection scheduling and report writing process.
Revision Rate Triggers
Level 1 (10–12% monthly): Review revision reasons with supervisor. Identify patterns, create improvement plan.
Level 2 (13–15% monthly): Mandatory retraining on identified weak areas. All reports reviewed before submission for two weeks.
Level 3 (above 15% monthly): Removed from rotation for specific clients or property types with highest revision rates. Formal performance improvement plan initiated.
Client Satisfaction Triggers
First complaint in 90 days: Document and review with appraiser. No formal action.
Second complaint in 90 days: Root cause analysis required. Client gets direct supervisor contact for next five orders.
Third complaint in 90 days: Client reassigned to senior appraiser. Full audit of all reports for that client over the past 60 days.
These aren't punitive — they're operational guardrails. The appraiser struggling with rural properties might excel at suburban residential. The whole point is catching problems early enough to redirect rather than escalate.
Hidden KPIs that separate thriving firms from struggling ones
Some metrics don't appear on any standard dashboard but predict success better than revenue or volume.
Inspection no-show rate: When this creeps above 5%, you've got scheduling, communication, or reputation problems. One firm traced more than half their delays to rescheduled inspections that nobody was tracking.
Draft abandonment rate: How many reports get started but never submitted? This reveals overwhelming complexity, unclear requirements, or capability gaps. Normal range is around 2–3%. Above 7% is worth investigating.
Revision iteration count: Most systems track whether a revision happened, not how many rounds it took. When reports average 2.3 revision cycles instead of 1.2, you're burning significant hidden hours.
Time-to-first-revision: The gap between delivery and revision request reveals how clients are actually reviewing your work. Under 24 hours means careful review. Over five days means batch processing — and your urgency signals don't matter to them.
Geographic efficiency score: Plot inspections on a map monthly. Calculate drive time as a percentage of total assignment time. Below 20% is solid. Above 35% usually means accepting assignments in coverage areas that aren't actually profitable.
Repeat client percentage: Not total client retention, but what percentage of clients order monthly. Sporadic clients cost more to serve and provide unstable revenue.
These metrics often explain why two firms with identical revenue and headcount show completely different profitability.
Turning metrics into operational improvements
Dashboards don't fix problems — they make them visible. The real work happens between identification and resolution, and most firms fall short here because they lack any systematic approach to acting on what they find.
Start with problem prioritization. That revision rate spike might look urgent, but if it's concentrated in one low-volume client while inspection scheduling chaos affects everyone, fix scheduling first. A simple impact/effort matrix helps. High impact, low effort fixes go first, regardless of who's loudest about a different problem.
Document every operational change carefully. When you adjust inspection scheduling, record the specific change, the date, and the baseline metrics. Check results after 30 days. Did turn times improve but revision rates spike? The change may have shifted problems rather than solved them.
Build feedback loops between metrics and training. Monthly metrics should drive next month's training topics. If comparable selection revisions jumped 40%, next month's session covers comparable selection. Obvious, but it rarely happens systematically.
Connect individual metrics to team goals. When an appraiser sees their revision rate in isolation, it feels punitive. When they see how dropping from 15% to 10% helped the team hit a client retention target, it feels different.
At a certain scale, operational software becomes necessary. Manual tracking in spreadsheets starts breaking down somewhere around 15–20 appraisers. You need automated data collection and calculation to maintain data quality, and more importantly, you need triggered notifications when metrics cross thresholds — because waiting for monthly reviews to catch problems means you're always playing catch-up.
Making it stick: the 90-day implementation plan
Gradual rollout matters more than most people expect. Appraisers need time to understand that metrics exist to improve operations, not evaluate individuals.
-
Days 1–30
Baseline and Setup
— Audit current data quality using the sampling rules. Build the three dashboard templates in whatever system you're using. Run calculations manually for one month to establish baselines. Document current performance across all proposed KPIs. Don't change anything yet — just measure. -
Days 31–60
Soft Launch
— Start weekly snapshot reviews (5 minutes, no consequences). Implement the monthly review cadence. Begin documenting problems but don't activate corrective actions yet. Train the team on what metrics mean and why they matter. Identify which metrics need better data collection. -
Days 61–90
Full Implementation
— Activate SLA triggers and corrective actions. Require documented responses to triggered events. Connect metrics to compensation or recognition. Refine thresholds based on two months of actual data. Automate calculations that have proven stable.
By month three, the system mostly runs itself.
The compound effect of systematic measurement
Month one just reveals problems. Month three shows patterns. Month six demonstrates actual cause-and-effect between operational changes and outcomes.
A 12-appraiser firm implemented this framework about 18 months ago. Initial metrics showed 6.2-day average turn times, 14% revision rates, and 40% of revenue concentrated in one client. Concerning, but not crisis-level.
Monthly reviews surfaced the root causes. Turn time delays were concentrated in the review bottleneck — one reviewer for 12 appraisers. Revisions stemmed primarily from inconsistent comparable selection criteria. The client concentration existed simply because they'd never actively pursued diversification.
Six months in, they added a second reviewer, built a comparable selection checklist, and started targeting specific lender types for new business. Turn times dropped to around 4.1 days. Revision rates hit 8%. Revenue concentration fell to 28%.
What the KPIs didn't directly measure but absolutely enabled: employee satisfaction climbed when rework dropped, client referrals increased because consistent delivery built trust, and the owner spent significantly less time managing crises. They now run 19 appraisers, maintain sub-4-day turn times, keep revisions under 7%, and no single client exceeds 20% of revenue.
The KPI system didn't create that growth. It enabled the operational consistency that made growth sustainable.
Beyond measurement: building a performance culture
Metrics without culture change produce compliance theater. People hit the numbers without actually improving operations.
Make metrics visible but not oppressive. Post the weekly snapshot where everyone can see it, but avoid calling out individuals publicly. Team averages reduce shame while maintaining some peer accountability.
Celebrate improvements more than absolutes. The appraiser who drops their revision rate from 20% to 12% deserves more recognition than the one who's been steady at 8% all year. Progress matters more than a static score.
Connect metrics to professional development. High performers should run workshops on their methods. Struggling performers get mentorship, not just criticism. When metrics become learning tools instead of judgment, the whole operation improves.
Share client feedback tied to specific numbers. When a lender mentions "quick turnaround" in their renewal conversation, connect it to your turn time improvements. When revision rates drop and clients notice, make that link explicit. Appraisers need to see how operational metrics translate to real business outcomes — otherwise the whole system feels abstract.
The best firms reach a point where appraisers track their own metrics proactively. They know their revision rate, their turn time, their efficiency scores, and they spot their own problems before any review surfaces them. When that happens, the system has actually worked.
Your KPI framework should evolve every quarter based on what you learn. The metrics that mattered at five appraisers might not serve you at fifteen. Thresholds that worked in a hot market need adjustment when volume softens. Build that evolution into the process rather than treating initial thresholds as permanent. The firms stuck in constant operational chaos share one characteristic: nothing gets measured systematically. The ones scaling smoothly know exactly which numbers predict problems and check them consistently. That gap is largely a choice.
Your KPI framework should evolve every quarter based on what you learn. The metrics that mattered at five appraisers might not serve you at fifteen. Thresholds that worked in a hot market need adjustment when volume softens. Build that evolution into the process rather than treating initial thresholds as permanent. The firms stuck in constant operational chaos share one characteristic: nothing gets measured systematically. The ones scaling smoothly know exactly which numbers predict problems and check them consistently. That gap is largely a choice.
Ready to elevate your appraisal operations?
Join 500+ appraisal firms using Rateoly to enhance accuracy, save time, and improve client satisfaction.