


Most appraisal shops can tell you their turn times, their exception rate, how many reports each appraiser knocked out last month. Ask them which assignment type is quietly losing money, and the room goes quiet.
That gap is the whole problem. KPIs get treated as scoreboard numbers — nice to look at, occasionally used to nudge someone about turn times — but they almost never get connected to the one number that keeps the lights on: profit per assignment. A firm can be hitting every operational target on the dashboard and still watch its margin erode, because the assignments driving the volume are the ones eating labor hours nobody priced for.
This post is about building the actual bridge between the two. Worked P&L at the assignment level, a clean way to map each KPI to a dollar effect, how to structure reviewer and appraiser pay in a way that doesn't fight the margin math, and a margin-at-risk view you can rebuild in a spreadsheet by the end of the week. The goal isn't a prettier dashboard. It's an appraisal assignment profitability model that tells you where the money actually goes.
Start at the assignment, not the month
The reason firms fly blind here is structural. Accounting rolls everything up to the month. Revenue in, payroll out, software subscriptions, rent, done. That view can look perfectly healthy while the underlying mix quietly rots.
This usually happens when a firm takes on a chunk of complex work — rural, mixed-use, unusual condition properties — at fees that were set for suburban tract homes. The monthly P&L still shows a profit because the easy volume subsidizes the hard stuff. Nobody notices until the easy volume dries up and suddenly the whole book is underwater.
To actually see it, you have to cost a single assignment end to end. Below is a worked example comparing a standard suburban 1004 versus a complex rural assignment the same firm treats as "just another order."
| Line item | Suburban 1004 | Complex rural |
|---|---|---|
| Fee collected | $525 | $650 |
| Appraiser labor (hrs × loaded rate) | 4.5 hrs × $55 = $248 | 9 hrs × $55 = $495 |
| Inspection + travel | $40 | $95 |
| Review time | 0.5 hrs × $60 = $30 | 1.5 hrs × $60 = $90 |
| Data / comps / software allocation | $22 | $28 |
| Admin (scheduling, intake, delivery) | $35 | $45 |
| Total cost | $375 | $753 |
| Assignment margin | +$150 (29%) | –$103 (–16%) |
The suburban file earns. The rural file, priced only $125 higher despite nearly double the labor, loses money on every order. A firm running forty of those a month is bleeding roughly $4k it can't see, because the monthly total still looks fine.
What's driving the loss isn't the fee alone — it's labor hours, review time, and the admin drag that never factors into anyone's mental math when quoting a job. Once you cost it this way, the pricing conversation changes completely. If you haven't formalized how complexity feeds into fees and service levels, the worked examples in Design SLA-linked pricing and service tiers for appraisal businesses pair directly with this — pricing is the lever, profitability is the readout.
Mapping KPIs to the dollar, not to a color
A dashboard full of green and red cells feels like control. Usually isn't, because a KPI only matters to the extent you know what a one-point move is worth. Turn time dropping from 6 days to 5 sounds good — but if it cost you a rush surcharge waiver and two hours of overtime to get there, you may have bought that improvement straight out of margin.
Manage every appraisal with confidence and clarity.
Rateoly helps you coordinate inspections, generate reports, and communicate seamlessly with clients.
- Comprehensive appraisal tracking
- Automated client notifications
- Integrated scheduling & report management
No credit card required
-
Revision rate. Every revision cycle runs roughly 1–1.5 hours of appraiser time plus 0.5 hours of review. At loaded rates that's around $85–$100 per revision. A firm running a 22% revision rate across 300 monthly files is spending somewhere in the range of $6k–$8k a month redoing work.
-
Turn time. Only matters to profit where it triggers SLA penalties or lost client volume. Faster-than-required turn time has near-zero dollar value and sometimes negative value if it's bought with overtime.
-
Review pass rate. A file that passes review first time costs one review pass. A file that bounces twice costs three, plus the appraiser rework in between. First-pass rate is one of the highest-leverage numbers in the whole model.
-
Capacity utilization. Below roughly 70%, you're paying for idle labor. Above roughly 90% sustained, revision rates tend to climb because people are rushing — so the KPI curves back on itself.
-
Assignment mix. The quiet one. The ratio of profitable to unprofitable assignment types moves margin more than any efficiency metric, and almost nobody dashboards it.
The mistake firms make is optimizing the visible KPIs — turn time, volume — because they're easy to measure, while ignoring the ones that actually carry the dollars (first-pass review rate, mix). If you want a grounded starting point on which metrics deserve a spot on the dashboard at all, which KPIs actually move the needle for appraisal teams is worth reading alongside this. That piece sorts signal metrics from vanity ones; this one converts the signal ones into money.
The incentive trap nobody talks about
There's a pattern that shows up constantly once you start costing assignments: the compensation structure is quietly rewarding the exact behavior that kills margin.
For appraisers:
-
Base split adjusted by assignment complexity tier, so a complex file that takes twice as long pays proportionally — removing the incentive to dodge hard work.
-
A small first-pass quality bonus (say $15–$25 per file that clears review with zero revisions). Cheaper than the rework it prevents, and it changes behavior fast.
For reviewers:
-
Tie a portion of pay to downstream outcomes — specifically the lender exception rate on files they cleared. A reviewer who signs off on files that later bounce back from the lender should feel that in their number.
-
Avoid paying reviewers purely on throughput. It's the single fastest way to gut review quality.
Incentives are just KPIs with money attached. If your dashboard says first-pass rate matters but your comp plan says volume matters, the comp plan is your real strategy — and it's probably fighting your margin.
What breaks when the firm grows
At five appraisers, the owner can hold the whole profitability picture in their head. They know Dave's rural files run long and mentally price accordingly. That instinct doesn't scale.
Somewhere around ten to fifteen appraisers and multiple review layers, the assignment-level economics become invisible to anyone. The scheduler assigns by availability, not profitability. Complex files get routed to whoever's free instead of whoever's fast at that property type. Fee exceptions get approved case by case with no memory of the pattern. Each decision is locally reasonable and collectively margin-destroying.
-
Intake — assignments accepted without complexity being scored, so the fee is wrong before work even starts.
-
Routing — files assigned by who's available, not by who's efficient on that type or whether the fee even covers the effort.
-
Review — bottleneck forms here as volume grows; either files queue (turn time balloons) or review gets rushed (exceptions climb).
-
Reconciliation — actual hours worked never get compared to the priced assumption, so the pricing never self-corrects.
Every one of those is a place where the gap between what an assignment costs and what you charged widens without anyone seeing it. In a growing firm, that gap compounds fast.
Building the margin-at-risk dashboard
Margin-at-risk is a simple idea: for each open and recently completed assignment, how much of the priced margin is exposed to being eaten by rework, overruns, or mispricing? You're not trying to forecast perfectly. You're flagging the files most likely to slip from profit to loss so someone can intervene while it still matters.
-
Set a standard cost per assignment tier. For each type — suburban standard, complex, rural, unique-property — lock in an expected hour count, review time, and admin load. This becomes your baseline: the "priced margin" for every file of that type.
-
Capture actuals as work happens. Log real appraiser hours, revision cycles, and review passes per file. Most firms skip this step, and skipping it is what makes everything else fall apart.
-
Compute variance per file. Priced margin minus actual cost. A suburban file priced for 4.5 hours that took 7 has burned its margin and then some.
-
Aggregate margin-at-risk. Sum the exposed margin across open files where actuals are trending past the baseline. That number is your early warning.
-
Segment by assignment type and by appraiser. Now the patterns surface — which types systematically overrun, which appraisers are efficient on which property types.
A minimal dashboard has five columns you can maintain in a spreadsheet: assignment ID, tier, priced margin, actual-to-date cost, and margin-at-risk (priced margin minus projected actual). Sort descending by margin-at-risk and you're looking at exactly the files that need attention today.
Visualize this workflow with a simple diagram:
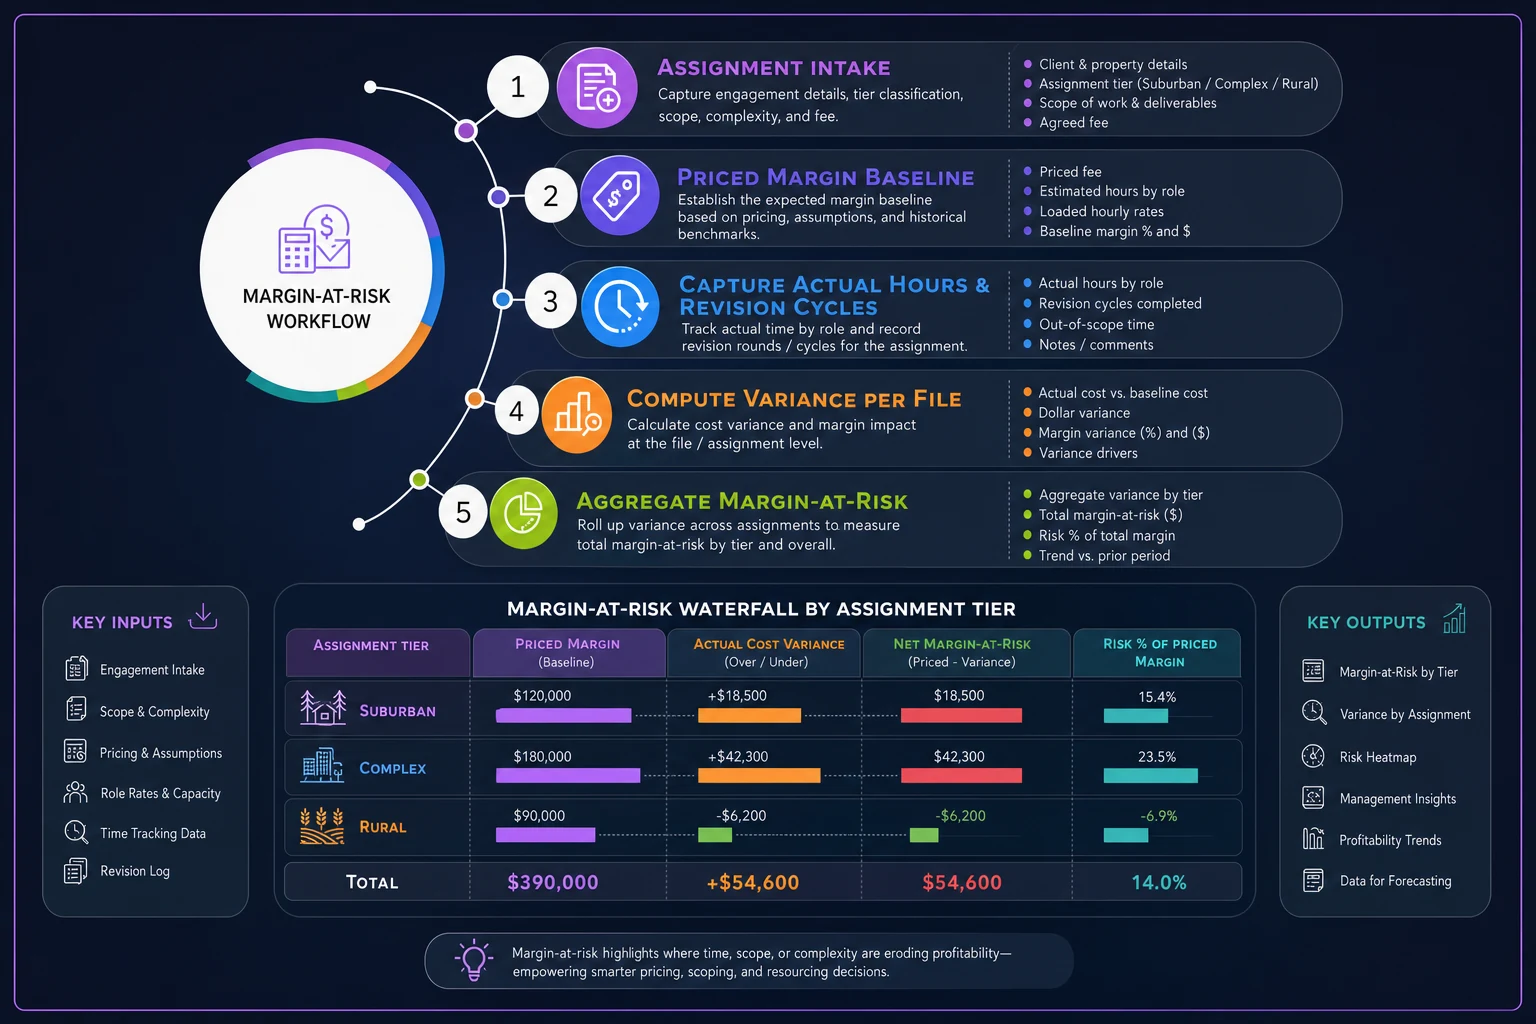
The reconciliation loop in step 5 is what makes the model self-correcting. When you can see that rural files run 40% over their priced hours every month, the rural fee isn't a debate anymore — the data hands you the number.
Where software earns its place — and where it doesn't
At a small firm, start with a spreadsheet. The math isn't the hard part. The hard part is capturing actual hours and review passes consistently, file after file, without turning it into a data-entry chore everyone resents. That's where the manual version usually dies — not because the model is wrong, but because nobody keeps feeding it.
Track actual hours and revision cycles within the existing workflow so logging happens automatically, not as a separate task.
This is where an AI-assisted operational platform starts to pay for itself. When intake, scheduling, review, and delivery already flow through one workflow system, actuals get captured as a byproduct of doing the work — hours, revision cycles, review passes, exception outcomes — instead of as a separate logging step. Automation can flag a file the moment its actual hours cross the priced baseline, surface assignment types that consistently overrun, and keep the margin-at-risk view current without anyone rebuilding a spreadsheet on Friday afternoon.
The point isn't the technology. A profitability model only works if the data behind it stays alive, and a connected workflow keeps it alive without adding a job to anyone's day. Use software to remove the friction of measurement — not to generate another dashboard nobody trusts.
When this level of rigor makes sense — and when it doesn't
When it's worth it: You're past five or six appraisers, you handle a genuine mix of assignment types, or you've expanded into a new market and can't quite explain why growth isn't showing up in profit. Any firm where the owner can no longer hold the economics in their head needs this.
When it's overkill: A solo appraiser or two-person shop doing one property type in one market. The instinct still works at that size, and the overhead of tracking per-file actuals will cost more than it returns. Do a rough tier-cost check once a quarter and move on.
Who should not start here: If your fee schedule hasn't been revisited in two years, fix pricing first. A profitability model on top of stale fees will just tell you, precisely, how much you're underpricing. Get the pricing structure sane, then build the model to keep it honest.
A real scenario
A regional firm — around twelve appraisers, two markets, roughly 280 files a month — couldn't figure out why a strong revenue year produced a weak profit one. Turn times were fine. Volume was up. The monthly P&L showed a thin but positive margin.
They costed one month of files by assignment tier. The suburban work was healthy, running close to 27% margin. The complex and rural files — about a quarter of volume — were sitting at roughly breakeven, with a meaningful slice actually negative once revisions were counted. Two appraisers were consistently 30–40% over the priced hours on rural work, not from carelessness but because those files were genuinely harder than the fee assumed.
The fixes were unglamorous: complexity tiering at intake, a fee bump on the two underwater tiers, routing rural files to the appraiser who was actually fastest on them, and a first-pass bonus to cut the revision drag. Nothing dramatic. Within a couple of quarters the overall margin moved up several points on flat volume — not because they did more work, but because they stopped losing money on the work they were already doing.
The takeaway
Productivity KPIs tell you how busy you are. They don't tell you whether being busy is making you money. The firms that stay profitable through rate swings and mix shifts aren't the ones with the fastest turn times — they're the ones who can cost a single assignment, see when its margin is at risk, and pay their people in a way that protects it rather than fights it.
Start with one month of files. Cost them by tier. You'll find the leak faster than any monthly report will ever show you.
Ready to elevate your appraisal operations?
Join 500+ appraisal firms using Rateoly to enhance accuracy, save time, and improve client satisfaction.