


Most appraisal firms don't have a quality problem. They have a quality visibility problem.
The review chief knows which appraisers tend to rush condition ratings. The office manager knows which lender client kicks back the most files. The senior appraiser knows that adjustments over a certain threshold usually invite a call. Everyone knows something — but none of it is written down in a way that connects, and none of it reaches the people making staffing and client decisions.
That works fine at 40 files a month. At 300 a month with contract appraisers you've never met in person, it quietly falls apart. The same defect shows up on Tuesday that you "fixed" three weeks ago, because the fix lived in one reviewer's memory and that reviewer was on vacation.
A real appraisal quality management system isn't a checklist taped to a monitor. It's the connective tissue between four things that usually operate in isolation: how you categorize defects, how you sample to catch them, how you fix them under SLA pressure, and how leadership actually sees the pattern in time to do something about it. Get those four talking to each other and quality stops being reactive firefighting.
The four disconnected pieces most firms run
Walk into almost any mid-size shop and you'll find versions of all four of these — just not connected.
Defect logging exists as freeform notes. "Comp 3 weak," "photos missing," "adjustment unsupported." Useful in the moment, useless for spotting patterns because no two reviewers describe the same problem the same way.
Sampling is usually "review everything from the new guy, spot-check the veterans." Reasonable instinct, but it's gut-driven and inconsistent week to week.
Corrective action happens verbally. Reviewer flags it, appraiser fixes it, file goes out. Nothing captures whether that appraiser makes the same mistake again next month.
Leadership reporting is turn-time and volume. Revenue in, files out. Quality only shows up when a lender complains loudly enough to reach the owner.
Each piece works in isolation. The failure is that they don't feed each other. Sampling doesn't get smarter based on the defect log. Corrective actions don't tie back to which SLA they threaten. And leadership never sees the connection between a recurring defect type and the client that's about to churn.
Start with a defect taxonomy — because you can't measure what you can't name
The single highest-leverage move is boring: agree on a fixed vocabulary for what "wrong" means. A defect taxonomy is just a controlled list of defect categories and subtypes that every reviewer uses, every time.
Manage every appraisal with confidence and clarity.
Rateoly helps you coordinate inspections, generate reports, and communicate seamlessly with clients.
- Comprehensive appraisal tracking
- Automated client notifications
- Integrated scheduling & report management
No credit card required
Without it, your data is garbage. "Weak comps" and "insufficient market support" and "adj not bracketed" might all be the same underlying problem, but if three reviewers phrase it differently you'll never see that it accounts for a third of your rework.
A workable taxonomy for a residential shop might look like this at the top level:
| Defect category | Example subtypes | Typical severity |
|---|---|---|
| Comparable selection | Distance exceeded without comment, dissimilar GLA, stale sale date | High |
| Adjustments | Unsupported line item, subject not bracketed, math error | High |
| Condition & photos | Missing required shot, rating mismatch to photos, metadata gap | Medium |
| Narrative & compliance | Boilerplate contradiction, missing certification, USPAP language | High |
| Data & file structure | Wrong form version, mislabeled exhibit, machine-review flag | Low–Medium |
The severity column matters more than people expect. A math error and a missing interior photo are not the same risk, and your remediation clock shouldn't treat them the same. Tagging severity at the taxonomy level is what later lets you connect a defect to an SLA.
One practical note on adoption: keep the top-level list short — five to seven categories. If reviewers have to scroll through 40 options mid-review, they'll pick "other" every time and you're back to freeform notes.
Sampling matrices: stop reviewing by gut
Once defects are named consistently, sampling can get intelligent instead of habitual.
A sampling matrix decides what percentage of each appraiser's files gets reviewed, based on their recent defect history and the risk profile of the assignment. New appraiser on a complex rural property? 100% review. Veteran with a clean 90-day record on a standard suburban refi? Maybe 10%.
The point isn't to review less — it's to point your limited review hours where the risk actually is. A rough starting matrix:
-
New / probationary appraisers 100% review, all severities, first 60 days
-
Appraisers with a high-severity defect in last 30 days 50% review until clean streak
-
Established, clean record, standard property 10–15% random sample
-
Any complex or unusual property, any appraiser 100% regardless of record
-
High-scrutiny lender clients minimum 25% floor regardless of appraiser
Automate sample-rate adjustments from defect logs so the matrix responds without manual intervention.
The mistake firms make is setting the matrix once and never letting the defect data move it. The whole value is that the matrix responds. If someone racks up three condition-rating defects this month, their sampling rate should climb automatically — not wait for a quarterly review meeting where someone remembers to bring it up.
This is also where a lot of manual coordination silently eats hours. Deciding sample rates, pulling the right files, tracking who's clean and who's not — that's exactly the kind of repetitive work worth pulling off appraisers' plates, which is covered in more detail in the automation inventory for appraisal chores.
Defect heatmaps: where leadership finally sees the pattern
A taxonomy plus consistent sampling unlocks something most firms don't have: a heatmap. Defect categories down one axis, appraisers (or lender clients, or property types) across the other, colored by frequency and severity.
Patterns that were invisible become obvious fast:
-
One appraiser is clean on everything except adjustment support — that's a coaching conversation, not a performance review.
-
One lender client generates twice the narrative-compliance defects — because their overlays are stricter and nobody ever documented them properly.
-
Rural properties light up red across the board on comp selection — you have a market-coverage gap, not an individual performance issue.
A real example: a firm running around 250 files a month discovered through a defect heatmap that close to 40% of their high-severity flags traced back to just two lender clients with unusual condition-reporting requirements. The appraisers weren't sloppy. Nobody had turned those clients' quirks into a standard instruction. One documented checklist per client cut that cluster significantly within two months.
That's the insight turn-time dashboards can't give you. They tell you how fast. A heatmap tells you where the risk concentrates — a different and more actionable question. If you're building out the metrics side, it pairs directly with which KPIs actually move the needle for appraisal teams.
SLA-linked corrective actions: connecting the fix to the clock
This is the piece almost everyone skips, and it's the one that protects revenue.
Every defect has a remediation cost measured in time. Every file has an SLA. When you connect the two, corrective action stops being "fix it whenever" and becomes a prioritized queue tied to what you've actually promised clients.
The logic is straightforward: a high-severity defect on a file due in 24 hours jumps the line ahead of a low-severity defect on a file due Friday. Without that linkage, reviewers fix things in the order they notice them — and you blow SLAs on files that were 90% done because a cosmetic issue on a less-urgent file grabbed attention first.
Tie each defect severity to a remediation window:
-
High severity corrected and re-reviewed same business day; escalates to review chief if it threatens the SLA
-
Medium severity corrected within 24 hours; tracked but doesn't auto-escalate
-
Low severity corrected before delivery; batched, not interrupt-driven
The pattern worth watching: when the same appraiser generates repeat high-severity defects, you don't just fix the file — you trigger root-cause work, because you're spending review capacity on a problem that keeps regenerating. That connection between one-off fixes and underlying causes is the whole point of turning lender exceptions into fixes with an RCA playbook.
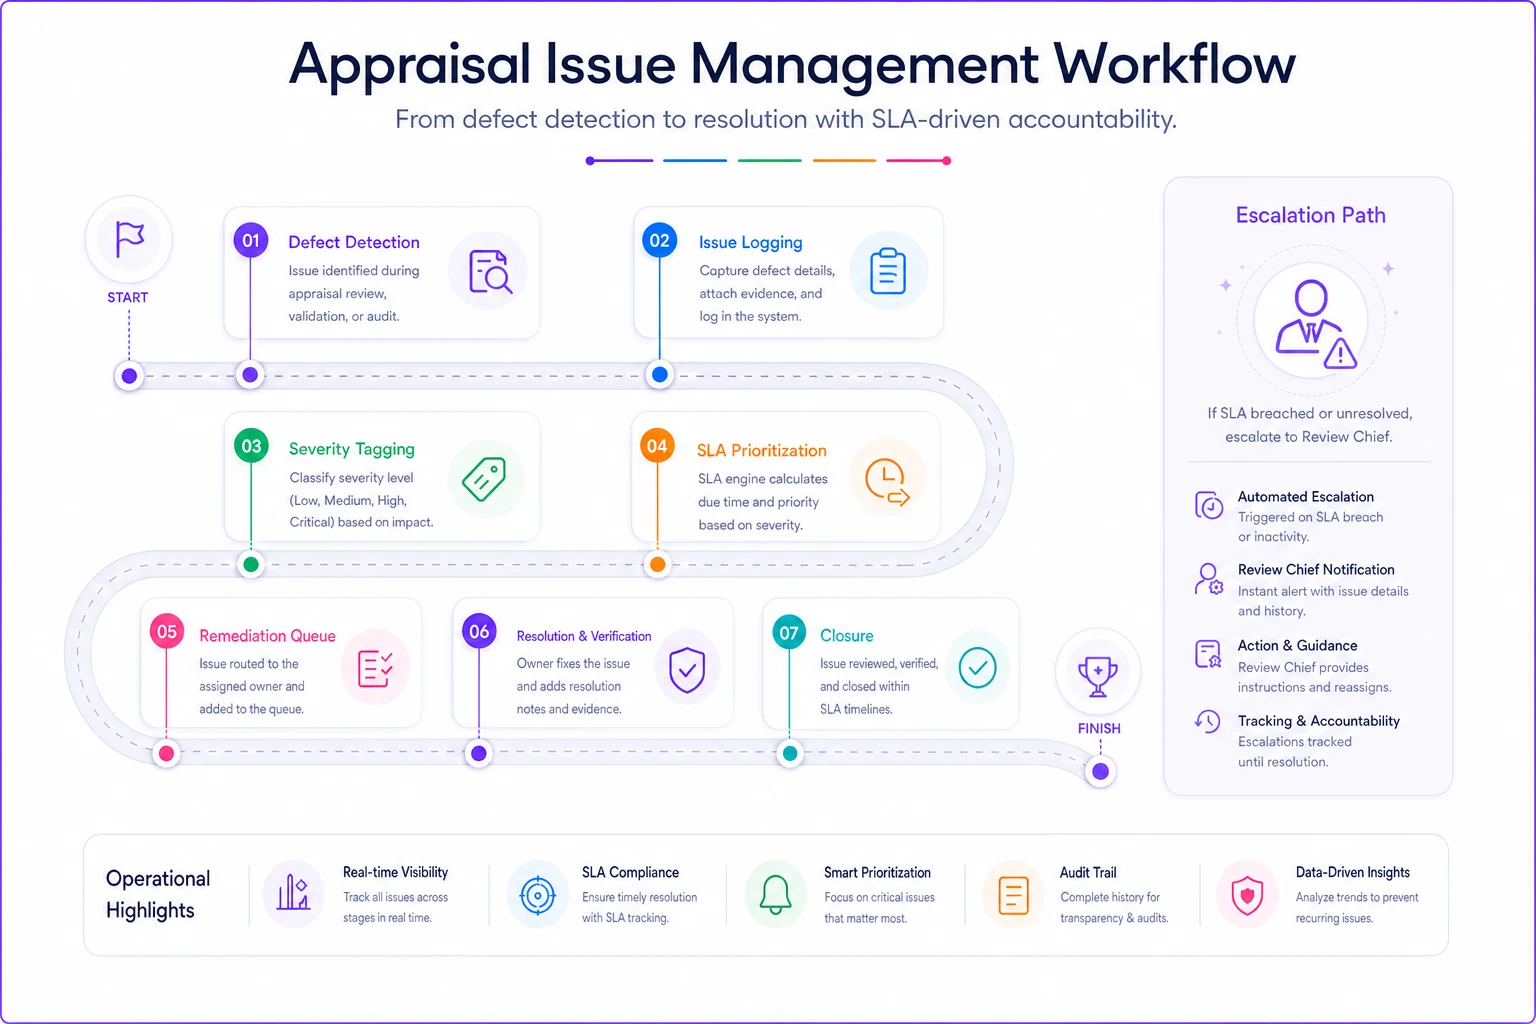
This sketch shows the process from defect detection to SLA-prioritized remediation and escalation.
That connection between one-off fixes and underlying causes is the whole point of turning lender exceptions into fixes with an RCA playbook.
Root cause analysis, then 30/60/90 remediation
Corrective action fixes the file. Root cause analysis fixes the reason. A QMS that only does the first is a very expensive way to keep re-experiencing the same problems.
When a defect crosses a threshold — say, the same subtype appears three or more times in 30 days from any source — it should trigger a structured RCA rather than another individual fix. Not a heavy exercise. Fifteen minutes asking: is this a training gap, a tooling gap, a client-instruction gap, or a genuine one-off?
From there, a 30/60/90 remediation template keeps the fix from evaporating:
-
30 days contain the immediate cause — targeted coaching, a checklist update, a corrected template, temporarily raised sampling rate for the affected area.
-
60 days verify the containment held. Did the defect rate for that subtype actually drop in the heatmap? If not, the root cause diagnosis was wrong.
-
90 days normalize. Fold the fix into standard onboarding, standard instructions, or the default template so new hires never hit it in the first place.
The failure mode is declaring victory at day 30 because the immediate fire is out. The defect rate looks better because everyone's paying attention. Then attention drifts, sampling drops back to baseline, and the problem quietly returns by month four. The 60- and 90-day checkpoints exist to catch that drift before it becomes a client conversation.
KPI → action mappings: making the numbers do something
A dashboard nobody acts on is just decorative. The last connection a real QMS needs is an explicit map from each metric to the action it triggers — so a threshold breach produces a decision, not a shrug.
A few mappings worth writing down:
-
High-severity defect rate climbs above baseline for a client → review and re-document that client's specific overlays and instructions.
-
One appraiser's defect rate in a single category spikes → raise their sampling rate and schedule targeted coaching, not a general performance review.
-
Rework hours rising while volume is flat → quality drift problem, not a capacity problem; investigate before hiring.
-
A property type consistently red on the heatmap → treat as a training or coverage gap and build a scenario-specific checklist.
Writing these down removes the judgment-call bottleneck. Right now, whether a rising defect rate gets acted on depends on whether the right person notices at the right moment. Mapped KPIs make the response consistent regardless of who's watching that week.
A real scenario: what changes when the pieces connect
Consider a firm running roughly 280 files a month — three staff appraisers, a rotating panel of five contractors. Turn times were fine, but rework was eating them alive. Reviewers estimated they were re-touching close to a quarter of files, and two lender relationships were getting shaky from repeated kickbacks.
They didn't buy anything fancy first. They started with a nine-category defect taxonomy and forced every review through it for six weeks. The heatmap that emerged was the eye-opener: over half their high-severity defects clustered in two categories — adjustment support and one lender's condition requirements — concentrated almost entirely among the contract panel who'd never gotten formal instruction on either.
The response wasn't dramatic. A one-page adjustment-support standard, a client-specific instruction sheet, and a sampling matrix that put every new contractor at 100% review for their first stretch. RCA on the adjustment cluster revealed a template gap, not a skill gap — the form wasn't prompting for supporting commentary at all.
Within a quarter, rework dropped from roughly 25% of files to somewhere around 10–12%. The two shaky lender relationships stabilized. Nothing about appraiser talent changed. What changed was that quality data finally connected — logged consistently, sampled intelligently, fixed with the SLA in mind, and surfaced to leadership before clients had to complain.
When this level of system makes sense — and when it doesn't
When it makes sense: You're past roughly 100–150 files a month, you use contract appraisers you can't watch directly, or you have lender clients whose defect kickbacks are threatening the relationship. The moment quality depends on specific people remembering specific things, you've outgrown informal review.
When it's overkill: A solo shop or a two-person firm doing 30–40 highly similar files a month. At that scale the reviewer is the system, and the memory-based approach genuinely works. Building a full taxonomy and sampling matrix there is process for process's sake.
Who should not rush this: Firms that haven't standardized their basic workflow yet. A QMS measures quality against a standard. If your handoffs and file structure are still ad hoc, fix that foundation first — otherwise you're measuring drift against a target that keeps moving, and your defect data will just be noise.
The real shift
The firms that scale cleanly aren't the ones with the most talented individual appraisers. They're the ones where quality survives turnover, vacations, and volume spikes because it lives in a connected system rather than in a few people's heads.
A defect taxonomy without sampling is a nice list nobody uses. Sampling without SLA-linked remediation catches problems too late to protect delivery. Remediation without RCA fixes the same thing over and over. And all of it is invisible unless it rolls up into something leadership actually looks at and acts on.
The point of an appraisal quality management system isn't more paperwork. It's making those four pieces feed each other so the same defect stops showing up on next month's files.
Ready to elevate your appraisal operations?
Join 500+ appraisal firms using Rateoly to enhance accuracy, save time, and improve client satisfaction.